Calculating FIFO cost base in Google Sheets
If you invest in crypto, you know how difficult it is to calculate your capital gains or losses. Maybe you rely on the dashboard on your exchange, but if gets more complicated than that: it's hard. Regardless if you have several wallets, want to look at a certain fixed time period, or if you try to get a sense of what you owe in taxes, you might want to use Google Sheets (or good old Excel) to approximate whatever your other tools show you.
The problem is, FIFO cost base isn't included with the built-in functions. You get revenue from a sale, but at which price did you buy? In many cases you didn't but the exact same amount, but built up an asset position over time, and each buy happened at a diffrent market price. And maybe you sell only a small amount, a number of times. So which price to assume for which amount?
There are a number ways how to calculate the gains. One is first-in-first-out, which is also the one most tax jurisdictions require you to use. It says that when you make a sale, you have to assume the price is from the oldest (first in) position that you still hold. This gets complicated quickly, unless you only have the simplest positions.
Last month, when getting confused over my crypto taxes, and waiting for the third-level support of my tax software vendor to come back to me, I filled the time with implementing FIFO cost base for Google Sheets. This is what you can use.
Assume you have a spreadsheet transactions of an assets. One only needs a price and amount column, and one particular sale amount you want to know the cost base for. We assume the orders are chronologically orderd from top down.
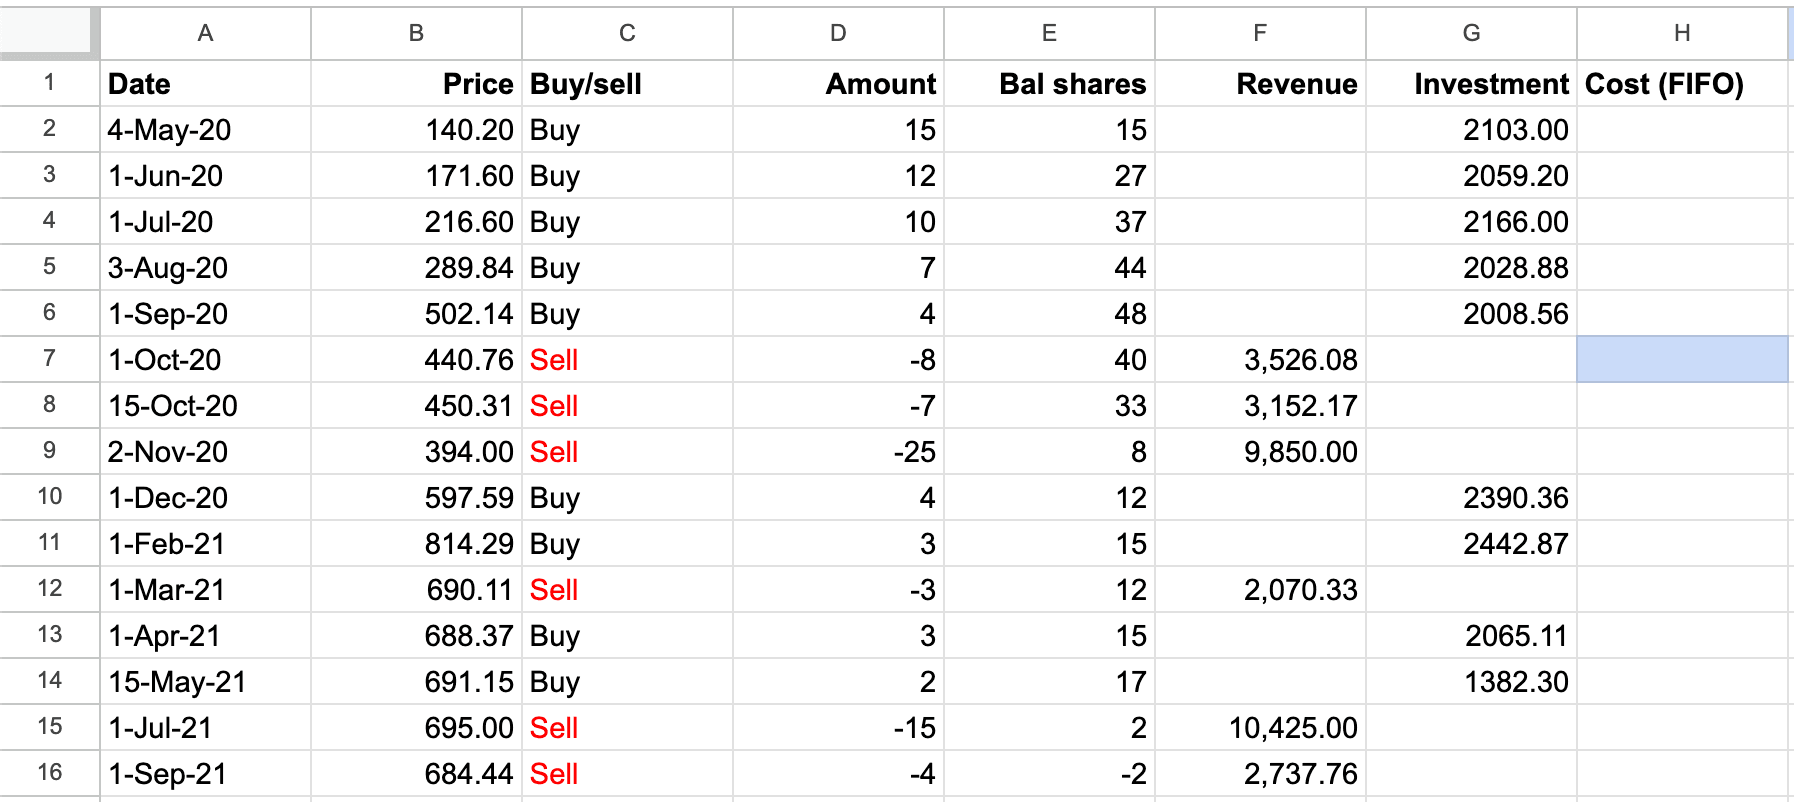
This might look like this:

Here you see the list of positions we want to calculate gains for. At H7 (highlighted in blue), we want the cost base for the sale of 1-Oct-21. The revenue is easy enough to calculate, but how much did we spend when buying? Place this formula in H7, which calculates it.
FIFO cost base calculation as Google Sheets formula=LET(
sell_amount, D7,
amounts, D$2:D$16,
prices, B$2:B$16,
PreSells, FILTER(amounts, ROW(amounts) < ROW(sell_amount)),
SumPreSell, REDUCE(0, PreSells, LAMBDA(acc, curr, IF(curr < 0, acc + ABS(curr), acc))),
BalBuy, SCAN(0, amounts, LAMBDA(acc, curr, IF(curr > 0, acc+curr, acc))),
PreSellRest, MAP(BalBuy, LAMBDA(a, a - SumPreSell)),
FillEndRest, MAP(PreSellRest, LAMBDA(ex, ex + sell_amount)),
AmountsClosed, MAP(PreSellRest, amounts, FillEndRest,
LAMBDA(pre, amt, fillrest, IF(pre > 0, MAX(0, MIN(pre, amt - MAX(0, fillrest))), 0))
),
SumAmountsClosed, SCAN(0, AmountsClosed, LAMBDA(acc, curr, acc + curr)),
CostItems, MAP(AmountsClosed, prices, LAMBDA(amt, p, amt * p)),
FIFOCost, REDUCE(0, CostItems, LAMBDA(acc, curr, acc + curr)),
IF(ABS(sell_amount) > INDEX(SumAmountsClosed, ROWS(SumAmountsClosed),1),
IFERROR(NA(), "Error: missing inventory"),
FIFOCost
)
)
This formula uses three inputs:
- the amount of the sale (expected to be negative, thus a sell). Above the
sell_amount, assigned cellD7 - the range of the amounts (again, buys are positive, sells negative). Above the
amounts, assignedD$2:D$16 - the range with the prices. Above the
prices, assignedB$2:B$16
Adjust those to your needs, and make the rows absolute, using the $, so you can easily spread the formula
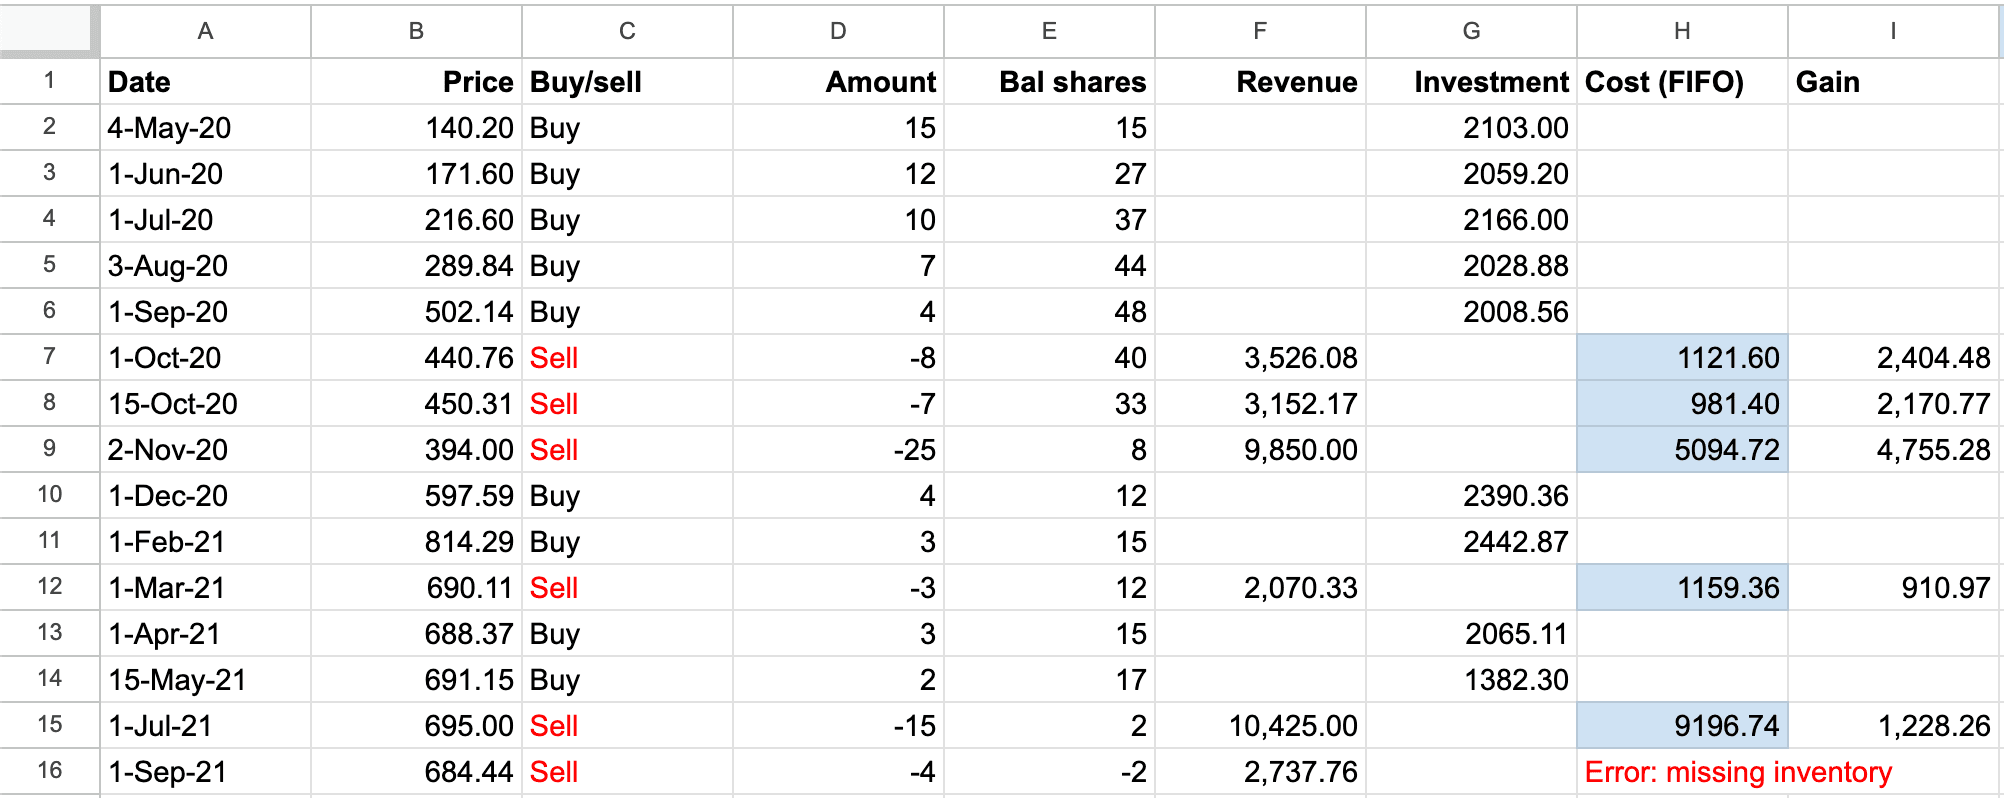
across the cost column. This produces the right values (highlighted in
blue), which make it trivial to calculate gains as well (revenue minus cost).

Note the error about "Missing inventory" at H16, introduced here intentionally. That error means that you sold more
than you own at that point. This is usually due to missing transactions in your list before.
Maybe you're missing transactions or overlooked an existing balance.
You can look at the Google Sheet yourself, to see it working and adapt to your needs.
Offered without warranty. Always check correctness independently yourself.